
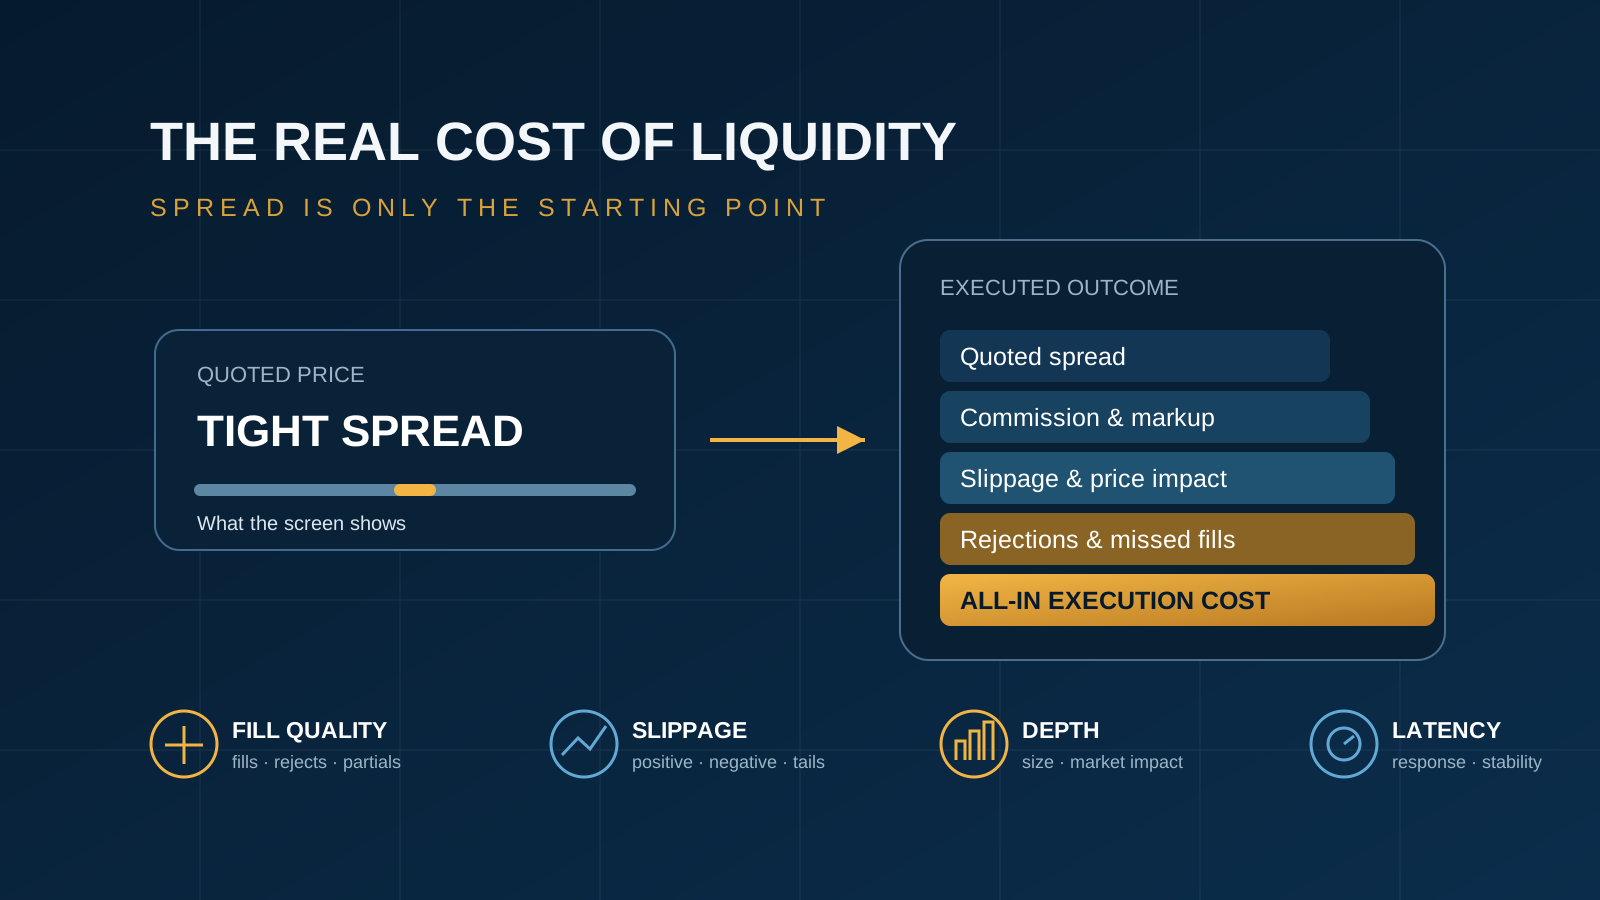
For a forex or CFD broker, a tight spread is attractive because it is visible, easy to compare and easy to market. But the spread shown on a screen is not necessarily the spread the broker can consistently execute. A provider quoting 0.2 pips can be more expensive than one quoting 0.4 pips if the first provider produces more negative slippage, more rejections, weaker depth or higher costs elsewhere in the relationship.
That distinction matters because liquidity should be evaluated as an execution outcome, not as a price advertisement. The correct question is not simply, “Which LP has the tightest spread?” It is: What does it cost us, on average and in stressed conditions, to execute the flow we actually send?
Quick answer
How should brokers measure the real cost of liquidity?
Brokers should measure liquidity using an all-in execution framework that combines quoted spread, commission or markup, slippage, rejections, partial fills, market impact, executable depth, latency, financing and operational reliability. The comparison should be segmented by symbol, ticket size, trading session, client-flow type and market condition rather than relying on a single monthly average.
1. Start with the difference between quoted spread and executable spread
The quoted bid-ask spread is the most obvious component of liquidity cost, but it is only the starting point. A price has economic value only when the brokerage can execute the required size against it. If the best price is available for a very small amount, disappears before the order arrives or is frequently rejected, the headline spread overstates the quality of the liquidity.
This is why two LPs displaying similar prices can produce very different outcomes. Provider A may show a narrower top-of-book spread but shallow depth. Provider B may show a slightly wider price but provide more stable liquidity across larger ticket sizes. For a broker that regularly externalises meaningful size, Provider B may be cheaper in practice.
A useful first distinction is between quoted spread, effective spread and all-in execution cost. Quoted spread describes what is displayed. Effective spread looks at the actual fill relative to a suitable reference price. All-in execution cost adds the remaining economic costs that influence what the brokerage ultimately pays.
2. Build an all-in liquidity cost model
There is no single industry formula that captures every brokerage model, but a practical internal framework can be expressed as:
All-in liquidity cost
Quoted spread + commission/markup + realised slippage + rejection/replacement cost + market impact + financing/carry + relevant infrastructure cost
Not every component should be allocated to every trade in the same way. Bridge fees, hosting and connectivity may be better analysed at account or volume level. Financing applies to positions held beyond the relevant rollover period. The point is not to force every cost into a single number at all times. It is to stop the brokerage from treating the displayed spread as the complete answer.
| Cost component | What the broker should measure | Why it matters |
|---|---|---|
| Quoted spread | Average and percentile spread by symbol/session | Shows advertised price competitiveness |
| Commission / markup | Cost per million or per lot | Converts headline pricing into comparable economics |
| Slippage | Positive, negative, average and tail outcomes | Shows the difference between requested and filled price |
| Rejections | Reject ratio and replacement-trade outcome | Rejected orders may force later execution at a worse price |
| Depth / impact | Executable size by level and ticket band | A tight top-of-book quote may not support real order size |
| Latency | Response-time distribution, not only the average | Slow or unstable responses increase stale-price and hedge risk |
| Financing | Swap/roll costs by instrument and direction | Can dominate spread cost for positions held overnight |
3. Slippage can erase the benefit of a narrow spread
Slippage is the difference between the price requested or expected and the price at which the order is ultimately filled. It can be positive or negative. A broker should therefore avoid measuring only negative slippage in isolation; the more informative view is the complete distribution of execution outcomes.
Suppose one provider is consistently 0.1 pip tighter but generates an additional 0.2 pip of negative slippage on a meaningful proportion of trades. The visible pricing advantage may disappear. The same can happen when the average looks acceptable but a small number of severe outcomes create client complaints or hedge losses during volatile periods.
Useful reporting should include average slippage, median slippage, positive-versus-negative frequency, the 90th or 95th percentile of adverse outcomes, and results split by instrument and ticket size. The tails matter because the brokerage is often exposed to its largest operational and client-service problems outside the average.
4. Rejections are an economic cost, even when no trade occurs
Rejected orders are sometimes excluded from cost analysis because there is no fill to compare. That can materially understate the real cost of a liquidity relationship. If a hedge request is rejected, the broker may remain exposed while it reroutes the order or sends a replacement request. The market can move during that interval.
A good analysis therefore records the rejection reason, time of rejection, subsequent order route, replacement price and elapsed time until successful execution. This creates a measurable rejection/replacement cost instead of treating the rejected trade as if nothing happened.
Last look deserves particular attention. Under last-look arrangements, an LP has a final opportunity to accept or reject a trade request against its quoted price. The FX Global Code contains principles around appropriate last-look behaviour, and the Global Foreign Exchange Committee has published additional guidance encouraging fair processes, clearer disclosures and sufficient information for liquidity consumers to evaluate rejected requests.
The issue for a broker is therefore not simply whether last look exists. It is whether the process is transparent, consistently applied and measurable.
5. Market depth matters more as ticket size grows
A spread comparison based only on the best bid and offer may be useful for small tickets but misleading for larger orders. The broker should examine how much volume is genuinely executable at each level and how quickly price deteriorates as size increases.
This is particularly important for symbols where headline liquidity can look attractive while depth is fragmented. Gold, indices, crypto-linked instruments and less liquid FX crosses can behave very differently from major currency pairs. The appropriate analysis is therefore a curve rather than a single spread number: what is the effective cost at the ticket sizes relevant to the brokerage?
For larger flow, the broker should also evaluate whether sweeping multiple levels produces predictable results and whether partial fills are operationally acceptable within its hedge and client-execution model.
6. Commission, markup and commercial terms must be normalised
Providers may express commercial terms differently: commission per million, commission per lot, spread markup, minimum monthly volume, account fees or bundled arrangements. Comparing those offers without normalising them can create false savings.
Convert charges into a common basis and model them against realistic volume. A lower commission may be offset by wider executable spreads. A zero-commission model may simply recover revenue through pricing. Minimum-volume commitments may look insignificant in a strong month but become expensive when volume falls.
The broker should also include costs that affect the liquidity relationship indirectly: bridge connectivity, dedicated lines, cross-connects, market data, hosting, additional sessions and reporting services where applicable.
7. Financing can outweigh execution cost for overnight positions
For strategies or client books that hold positions overnight, swaps and financing can become more economically important than entry spread. A provider that is competitive for intraday flow may be unattractive for longer-held positions if financing is materially worse.
Financing should therefore be compared by instrument, direction and holding period. Brokers should monitor changes over time because financing schedules can change independently of headline spreads. Where the broker internalises some positions and externally hedges others, it should also understand how financing differences affect the profitability of that risk model.
8. Latency should be measured as stability, not just speed
“Low latency” is often presented as a single number, but the average can hide instability. A provider with a 15 millisecond average but occasional 300 millisecond responses may create more operational risk than a provider consistently responding in 25 milliseconds.
Measure response-time distributions, timeouts, disconnects and performance by trading session. The broker should also separate LP latency from bridge, platform and hosting latency. Otherwise the wrong provider may be blamed for a technology problem elsewhere in the execution chain.
Latency matters economically because market prices continue moving while an order is travelling, being checked and being acknowledged. Unstable response times can increase slippage, stale-price exposure and the time the broker remains unhedged.
9. Use markouts carefully to understand what happens after the fill
A markout compares the execution price with a reference market price after a defined interval—for example 100 milliseconds, one second or five seconds. It can help brokers and LPs understand whether flow tends to move favourably or adversely after execution.
Markouts are useful, but they should not become a simplistic label for “good” or “bad” clients. The result depends heavily on the benchmark, horizon, symbol, strategy and market regime. They are most useful when combined with fill data, slippage and client-flow segmentation to explain why execution outcomes differ.
For brokers, the practical benefit is diagnostic. If a specific flow segment receives rising rejection rates or worse pricing, markouts can help determine whether the issue is flow characteristics, routing, latency or a deterioration in the provider relationship.
10. Segment the data or the averages will mislead you
A brokerage can have a reasonable overall fill ratio while one major symbol is deteriorating. It can have neutral average slippage while large tickets experience consistently adverse execution. It can also have strong London-session performance and weak rollover or news-event performance.
At minimum, liquidity reporting should be segmented by:
- Liquidity provider
- Symbol or asset class
- Ticket-size band
- Trading session and hour
- Order type
- Client or flow segment, where appropriate and lawful
- Normal versus volatile market periods
- Accepted, rejected and partially filled requests
This makes the analysis actionable. The objective is not merely to produce a monthly TCA report. It is to identify where routing, allocation, limits or provider discussions need to change.
11. A practical broker liquidity scorecard
Once the data is normalised, LPs can be compared with a weighted scorecard. The weighting should reflect the brokerage’s business model rather than following a generic industry template.
| Area | Example weighting | Core metrics |
|---|---|---|
| Execution cost | 30% | Effective spread, commission, slippage |
| Fill quality | 20% | Fill ratio, rejects, partial fills |
| Depth and scalability | 15% | Cost by ticket band, market impact |
| Latency and resilience | 15% | Response distribution, disconnects, uptime |
| Financing | 10% | Swap competitiveness and stability |
| Operational support | 10% | Investigations, escalation, reporting |
The weighting can change. A high-volume scalping business may give greater weight to latency and fill quality. A brokerage with longer-held positions may assign more weight to financing. A business externalising larger institutional-style tickets may focus more heavily on depth and impact.
12. Transaction cost analysis should become an operational process
Transaction cost analysis (TCA) is most valuable when it is embedded into the brokerage’s operating rhythm. The Global Foreign Exchange Committee provides a TCA Data Template intended to support more standardised execution analysis. While each broker will need its own methodology, the broader principle is important: execution should be measured using consistent data definitions so providers can be compared fairly.
A practical process is:
- Collect clean execution data. Preserve quote/request timestamps, requested price, fill price, reject reason, quantity, LP, symbol and route.
- Define consistent benchmarks. Decide which reference price and timestamp are appropriate for each metric.
- Segment the results. Avoid relying on blended averages.
- Investigate deterioration. Identify whether changes are provider-specific, market-wide or technology-related.
- Adjust routing or allocation. Move flow only when the data supports the decision.
- Review with providers. Use evidence rather than anecdotal complaints.
The GFXC’s updated FX Global Code continues to emphasise transparency and robust market practices, while its disclosure and TCA materials provide useful reference points for liquidity consumers assessing electronic execution.
13. What should appear on a daily or weekly liquidity dashboard?
A useful dashboard does not need hundreds of fields. It should surface the metrics that tell the operations or dealing team whether execution quality has changed materially.
- Quoted and effective spread by top symbols
- Fill and rejection rate by LP
- Average and tail slippage
- Execution cost by ticket-size band
- Response-time distribution and timeout count
- Partial fills and reroutes
- Top rejection reasons
- Depth deterioration in key instruments
- Material financing changes
- LP incidents, disconnects or pricing anomalies
These controls fit naturally into the broker’s wider daily brokerage operations framework. Liquidity performance should not be isolated from exposure, platform health, reconciliations and incident management.
Common mistakes when comparing liquidity providers
- Choosing by demo spread. Demo pricing may not reproduce live execution conditions.
- Using one blended monthly average. It can hide weak symbols, sessions or ticket bands.
- Ignoring rejected requests. A rejection can create real replacement and hedge costs.
- Comparing different definitions. Metrics must be calculated consistently across LPs.
- Ignoring financing. Overnight economics can dominate entry cost.
- Blaming the LP for every latency issue. Bridge, hosting and platform performance must be separated.
- Optimising only for the current flow mix. The brokerage should test whether the provider can scale as volumes and client profiles change.
Conclusion: the cheapest liquidity is the liquidity that executes well
The pursuit of tight spreads is understandable. They influence client pricing, marketing and headline competitiveness. But spread alone is an incomplete measure of the economic quality of a liquidity relationship.
A broker should evaluate the full path from quote to execution: whether the price is genuinely executable, how much size is available, how often orders are rejected, what slippage occurs, how quickly the provider responds, what the financing costs are and how reliably the relationship performs during difficult markets.
That is also why liquidity-provider selection should not end after onboarding. The framework used to choose a liquidity provider should continue into live monitoring. Execution conditions change, client flow changes and commercial terms change. The provider that was cheapest six months ago may not be cheapest today.
For the brokerage, the objective is simple: measure what is actually paid and actually executed—not merely what is displayed.
Frequently asked questions
Real cost of liquidity FAQs
Why is the tightest liquidity-provider spread not always the cheapest?
Because the displayed spread is only one component of execution cost. Slippage, commissions, rejections, partial fills, market impact, financing and latency can make a provider with a tighter quote more expensive after execution.
How should a forex broker measure liquidity-provider execution quality?
Measure fill ratio, rejection rate, positive and negative slippage, response time, partial fills, executable depth, effective spread and performance by symbol, ticket size, trading session and market condition.
What is effective spread for a broker?
Effective spread measures the distance between the executed price and an appropriate reference or mid-price rather than relying only on the provider’s displayed bid-ask spread.
Should brokers measure rejected orders as a cost?
Yes. Rejections can create missed trading opportunities, delayed hedges and replacement trades at worse prices, so rejection behaviour should be included in the broker’s assessment of all-in execution quality.
What is transaction cost analysis for a forex broker?
Transaction cost analysis is the structured measurement of execution outcomes against reference prices and benchmarks. It can compare providers across spread, slippage, fill quality, latency, market impact and other execution metrics.
Reviewing your liquidity performance?
Measure execution beyond the headline spread.
Spot Liquidity helps forex and CFD brokers review liquidity-provider performance, execution reporting, bridge configurations, routing and the operational controls around their liquidity setup.
Book a ConsultationFurther reading
This article is provided for general informational purposes only and does not constitute financial, legal, regulatory or tax advice. Execution models, liquidity arrangements and regulatory requirements vary by jurisdiction and business model. Independent professional advice should be obtained where appropriate.